“The network is alive” — Networks and those who maintain them
- Publish On 15 May 2024
- Hafid Ait Sidi Hammou
- 8 minutes
The French underground and aerial landscape is made up of approximately 910,000 km of drinking water distribution pipes, and over 1.4 million km of power lines. Indispensable in our daily lives, they are nonetheless invisible and increasingly questioned in the light of ecological and technological challenges that are transforming our territories. But can’t these infrastructures be seen as a heritage to be maintained and cared for?
Focus on network maintenance rather than development
Although they were seen as technologies marking the advent of modernity at the time of their construction, distribution networks are today absent from public debate or portrayed sometimes as vulnerable technologies that are collapsing, sometimes as technologies that are increasingly efficient because they are optimized and automated. Taking a closer look at the practices of those who keep these networks running on a day-to-day basis can help us to get a better grasp of objects that are both familiar and unfamiliar to us.
The history of networks doesn’t end with the first inventions, or with the major construction and extension projects that brought these various cables, wires and pipes to most French homes. A whole story remains to be told of these technologies in use, which are, as David EdgertonEdgerton, D. (2006). The Shock Of The Old: Technology and Global History since 1900 (1st ed.). London: Profile Books. writes are often more significant today than in their early days, when they were not so interwoven into our cities, our equipment and our daily lives. Advocating a shift away from a historically focused interest in innovation, the historian also notes that the majority of scientists and engineers are in fact far more concerned with the operation and maintenance of technologies than with their development. So what do they actually do? They are involved, along with many other technicians, in answering questions that are more problematic than they seem: how do you go about finding leaks in a drinking water network, or pruning around a power line? How are geographic information systems and mobile digital tools transforming network knowledge? How to make operating and investment choices on an existing network?
The study of technical networks was largely developed in the 1980s, focusing on the history of these technologies and their links with the urban fabric. Examples include Networks of PowerHughes, T. P. (1983). Networks of power electrification in Western society, 1880-1930. Baltimore: Johns Hopkins University Press. which introduces the category of “major technical networks”, or Technology and the Rise of the Networked City in Europe and AmericaTarr, J. A., Dupuy, G. (1988). Technology and the rise of the networked city in Europe and America. Philadelphia: Temple University Press. . This literature has done much to demonstrate the importance of the development of technical networks in urban construction between the 19th and 20th centuries, but it has not examined the contemporary use of these networks and the operational and theoretical questions it raises.
In a 2007 programmatic article, Stephen Graham and Nigel ThriftGraham, S., Thrift, N. (2007). Out of Order: Understanding Repair and Maintenance. Theory, Culture & Society, 24(3), 1-25. pose the following paradox: how can we grasp the lack of interest in the intensive, continuous work that holds the technical networks of our cities together, after so much emphasis has been placed on their structuring power? The often invisible nature of this type of infrastructureStar, S. L. (1999). The Ethnography of Infrastructure. The American Behavioral Scientist (Beverly Hills), 43(3), 377-391. appears to be a first response. They note that this consequently creates a particular attraction for the study of disasters and massive breakdowns that make these infrastructures visible and reveal part of their behind-the-scenes storyThis axis will be pursued in particular in: Graham, S., Marvin, S. (2010). Disrupted Cities: When Infrastructure Fails (1st ed.). Florence: Routledge. Finally, for these authors, the myth of a solid, universal infrastructure, dominant in the ideal of the modern Western city, has also contributed to the fact that“continuous efforts of repair and maintenance […] still tend to be rendered invisible both culturally and analytically”, Graham, S., Thrift, N. (2007). p.10. Translation by the author. this myth has been challenged by studies of cities in the Global South, where it made no senseSee for example Jaglin, S. (2012). Services en réseaux et villes africaines: l’universalité par d’autres voies? L’Espace géographique, 41, 51-67. and continues in critical studies of the evolution of networksVoir par exemple Florentin, D. (2018). La bifurcation infrastructurelle. Revue européenne des sciences sociales (Cahiers Vilfredo Pareto), 56-1, pp.241-262.
Describing infrastructure heritage: a test of knowledge
The subject of network lifespan is an integral part of the concerns of those who contribute to their operation and maintenance. Daniel Florentin and Jérôme Denis follow the work of operators of drinking water distribution networks in their management of infrastructure “as a heritageFlorentin, D., Denis, J. (2020). Réseaux techniques. Un tournant patrimonial? Matthieu Adam; Emeline Comby. Le capital dans la cité: Une encyclopédie critique de la ville, Editions Amsterdam, pp.331-339, 2020.“ that must be maintained and cared for. At a time when the millions of cables and pipes that cover France are caught between service disruptions, their inevitable ageing, public resources under strain and more stringent regulatory requirements; for these authors, this “patrimonial turnaround” represents a “knowledge”, “financial and accounting” and “organizational” test. Without going into the details of these challenges here, let’s just say that they highlight practices as diverse as the difficulty of mapping a network, the problematic separation between operating and capital expenditure, and the lack of coordination between technical departments with unequal capacities for action.
These challenges, and particularly those of knowledge, were partly expressed as part of the France Data Réseau (FDR) project of the Fédération Nationale des Collectivités Concédantes et Régies (FNCCR), which focused on working with legacy data from various networks in different territories. Between the end of 2021 and the beginning of 2023, several network operators explored four data “use cases”, “adapted to the needs and business issues of networked utilitiesFrance Data Réseau website: https://www.francedatareseau.fr/”. By looking at drinking water pipe failures; the contribution of public lighting to light pollution; the drafting of a master plan for electric vehicle charging stations; and the occupation of common supports (the poles over which electricity distribution and often fiber optic distribution run), the FDR project has highlighted the uneven and often incomplete knowledge of these assets in order to meet its objectives.
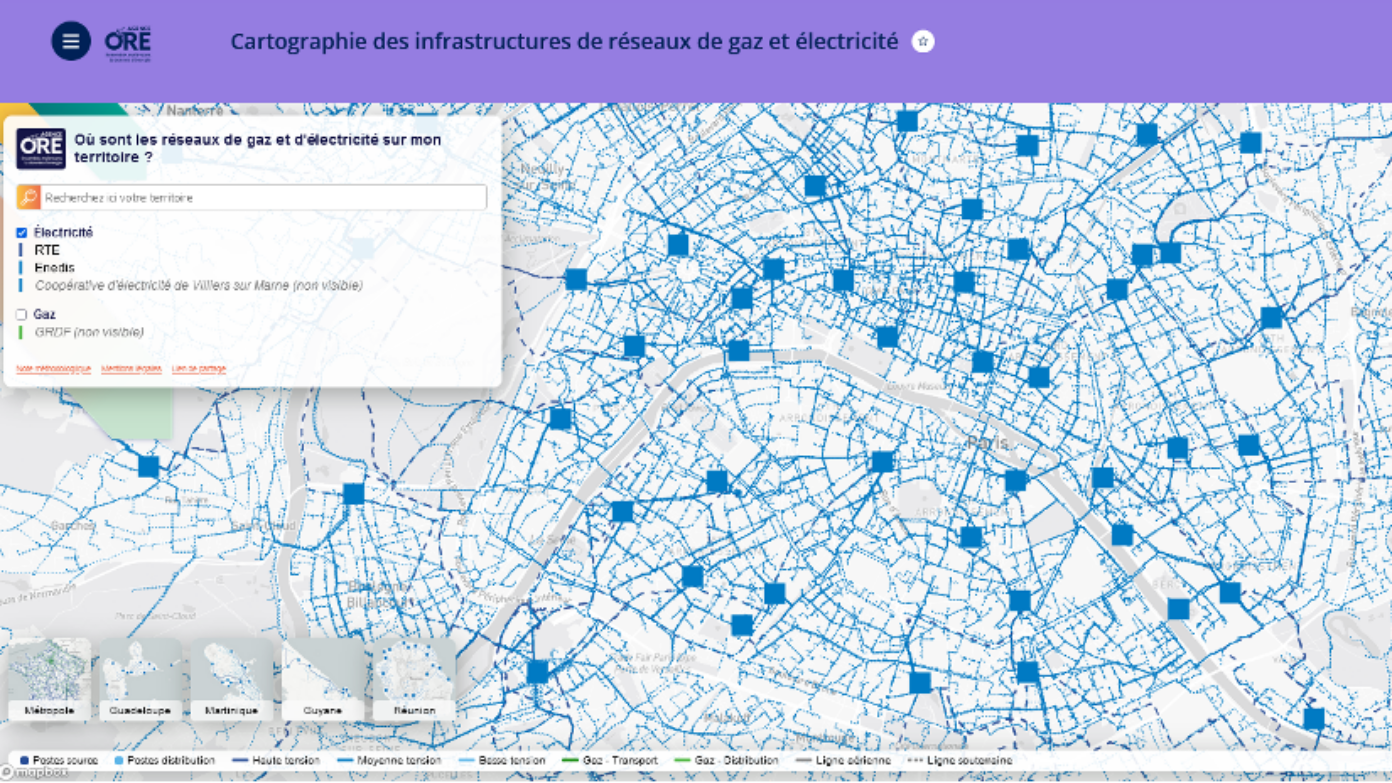
The call to consolidate exhaustive mapping of networks is one of the first elements to emerge from FDR, which has sought to initiate the movement with these first use cases demonstrating their importance – such as the study of light pollution induced by public lighting or the collection of fees for occupying common supports. But where are these light points and common supports in the first place? While some local authorities had carried out recent, accurate inventories, others had more fragmented or dated information. This cartographic question also arises in other ways, when these same network managers have to respond with precise plans to declarations of work on the road to prevent damage to the latter, particularly when they are categorized as sensitive. Once again, there’s nothing obvious or easy about the production and sharing of this data, which is so necessary when it comes to ensuring the longevity of an asset.
Figure 1: cartographic visualization of ENEDIS and RTE network infrastructures in Paris, via the ORE agency’s open data portal: https://www.agenceore.fr/datavisualisation/cartographie-reseaux
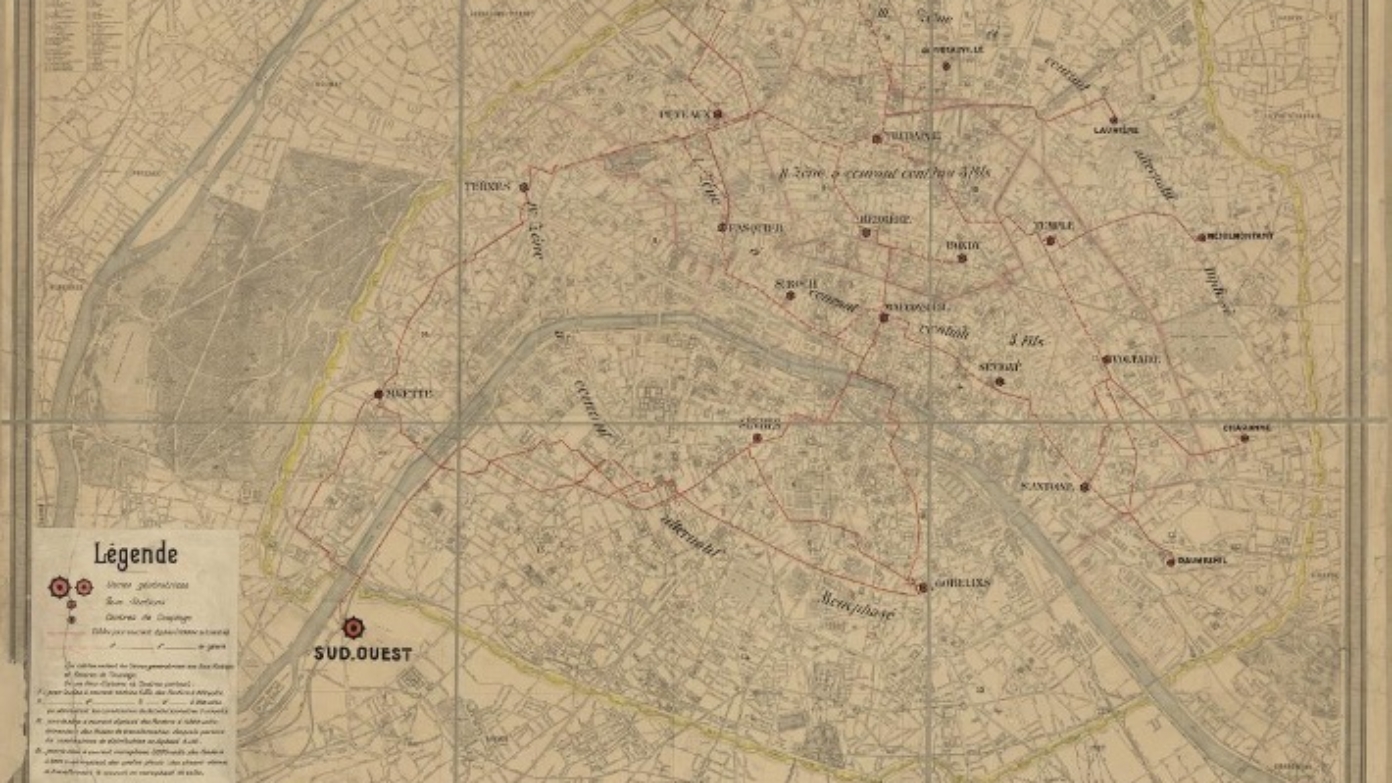
Figure 2: map of the cables linking the generating plants to the substations and coupling centers of the Compagnie parisienne de distribution d’électricité, 1909. Scale 1:10000. Andriveau-Goujon, E. Bibliothèque Historique de la Ville de Paris
Network mapping has become the cornerstone of asset management work for many network operators, facilitated by the growing use of Geographic Information Systems (GIS), both as a database and as a processing and visualization tool. These GIS systems are part of a long history of documenting the life of networks, which sometimes has to be reconstructed, and then constantly updated, particularly when maintenance work is carried out.
Optimizing network operations: choices and underlying assumptions in question
FDR’s use cases also allow us to delve into the complexity of qualifying the state of networks. If making them last means “watching over their condition and scrutinizing their variations and transformationsDenis, J., & Pontille, D. (2020). Maintenance et attention à la fragilité SociologieS, 2020-05. p.5“, what exactly should be scrutinized and monitored? The drinking water use case, for example, sought to “characterize the risks of failure” and “assess the need for pipe renewalFrance Data Réseau website, drinking water use case page: https://www.francedatareseau.fr/cas-dusage/eau-potable”. In this case, it wasn’t the pipe inventory that posed a problem, but rather the detailed description.
Two categories of data focused the attention of the local authorities in this working group. Firstly, data relating to pipe diameter, material and laying period (depending on the local authority, this data was more or less present, for all or part of the pipes inventoried, and with variations in material labels, for example). Secondly, data on the history of identified failures. Here again, not all local authorities had a history, or details of the intervention or the section concerned. In addition to highlighting differences in practices and assets between regions, this use case also highlighted the difficulty of characterizing the condition of a network and its “need for renewal”. What do these data say about the state of the network, its fragility, its expected life expectancy? While the focus was on failure history as a key variable to be consolidated for estimating expected breakage rates or future renewal needs, this use case also helped to raise the limits of this reasoning for understanding failures: is it a particular material or level of ageing that makes breakage more likely? Or is it a particular area which, because of the pressure of road traffic, for example, is subject to the most stress on the pipes? Without being exhaustive, these initial questions remain open and need to be studied locally.
Ultimately, if the ambition of this type of project remains focused on forecasting and decision-support models (even going as far as artificial intelligence), we can see that they are largely dependent not only on the knowledge to be reconstituted, but also and above all on the starting hypotheses to be defined on these issues. It is therefore important to stress the importance of these questions, which feed into political, technical and financial choices and shape the management of network assets.
